This is an old revision of the document!
Operator's interface
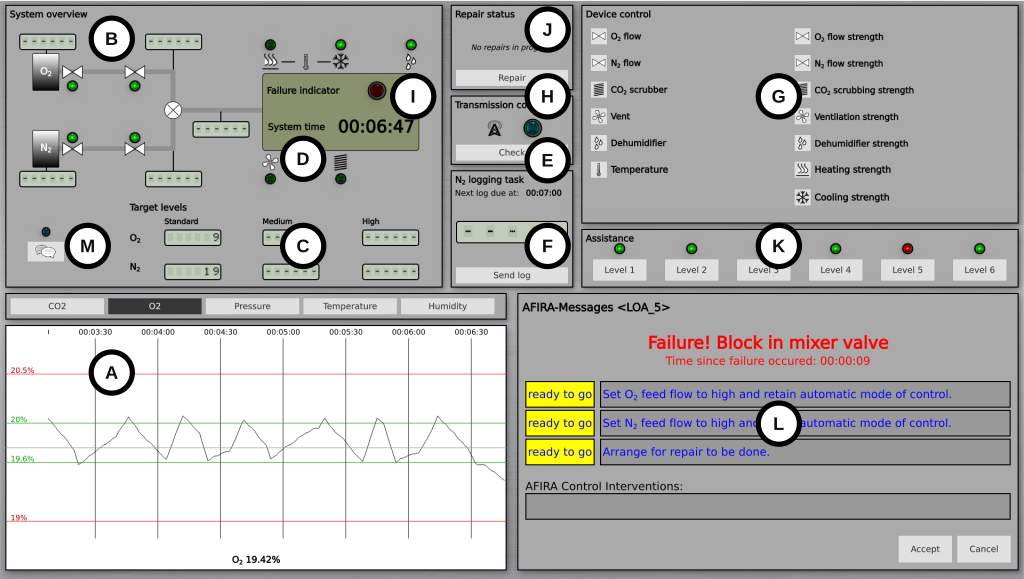
The operator’s interface is organized into several sections:
- (A) history display showing graphs of the five key parameters;
- (B) system layout with a functional diagram of the cabin, including the status of specific devices like valves and flow meter readings;
- (C) target values for flow rates;
- (D) current system time;
- (E) a transmission control signal and response button for the secondary task of probe detection;
- (F) a panel for the nitrogen logging task related to prospective memory;
- (G) a control panel for manual system control;
- (H) a repair request button;
- (I) a system failure indicator;
- (J) a repair status indicator;
- (K) an automatic support level indicator;
- (L) the Automated Fault Identification and Recovery Agent (AFIRA); and
- (M) a button to access the chat function.
In the system overview (B), green signals indicate active devices and open valves. Tank level and flow meter readings are hidden by default and require the participant to click or tap the display to view the current reading. This action is logged, and the display disappears after 15 seconds, enabling later analysis of information sampling behavior.
operator_interface.1727177997.txt.gz · Last modified: 2024/09/24 13:39 by admin